served from digilib.icpac.net
ENACTS version0 CIPH CSMT PcpnCondProb: Percent Occurrence of Precipitation Condition in Historical Record data
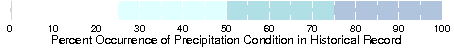
Percent Occurrence of Precipitation Condition in Historical Record from ENACTS version0 CIPH CSMT: Climatic Suitability for a Malaria Transmission.Independent Variables (Grids)
- Month (time)
- grid: /T (months since 01-Jan) periodic (Jan) to (Dec) by 1.0 N= 12 pts :grid
- Longitude (longitude)
- grid: /X (degree_east) ordered (21.855E) to (51.455E) by 0.05 N= 593 pts :grid
- Latitude (latitude)
- grid: /Y (degree_north) ordered (11.775S) to (23.125N) by 0.05 N= 699 pts :grid
Other Info
- CE
- 100.0
- CI
- 25.0
- colorscalename
- precip_colors
- CS
- 0.0
- datatype
- realarraytype
- fnname
- flagge
- maxncolor
- 254
- missing_value
- NaN
- pointwidth
- 1.0
- scale_max
- 100.0
- scale_min
- 0.0
- units
- unitless
- history
- Averaged over T2[1981, 2023] minimum 0.0% data present
- colorscale
References
Grover-Kopec, E. K., M. B. Blumenthal, P. N. Ceccato, T. Dinku, J. Omumbo, S. J. Connor, 2006: Web-based climate information resources for malaria control in Africa. Malaria Journal, 5:38.
Last updated: Fri, 19 Apr 2024 06:47:20 GMT
Expires: Fri, 10 May 2024 00:00:00 GMT
Data Views
| T | X | Y | |
| M | M | M |
|---|
Filters
Here are some filters that are useful for manipulating data. There are actually many more available, but they have to be entered manually. See Ingrid Function Documentation for more information.- Monthly Climatology calculates a monthly climatology by averaging over all years.
- anomalies calculates the difference between the (above) monthly climatology and the original data.
- Integrate along X Y T
- Differentiate along X Y T
- Take differences along X Y T
RMS (root mean square with mean *not* removed) over X Y T | X Y X T Y T | X Y T |
RMSA (root mean square with mean removed) over X Y T | X Y X T Y T | X Y T |
Maximum over X Y T | X Y X T Y T | X Y T |
Minimum over X Y T | X Y X T Y T | X Y T |
Detrend (best-fit-line) over X Y T | X Y X T Y T | X Y T |
Note on units